Grafana§
Here, we install Grafana from sources so we can configure it to run on Unit.
Install Unit with a Go language module.
Also, make sure Unit’s Go module is available at $GOPATH.
Download Grafana’s source files:
$ go get github.com/grafana/grafana
Update the code, adding Unit to Grafana’s protocol list. You can either apply a patch (
grafana.patch):$ cd $GOPATH/src/github.com/grafana/grafana
$ curl -O https://unit.nginx.org/_downloads/grafana.patch
$ patch -p1 < grafana.patch
Or update the sources manually. In conf/defaults.ini:
#################################### Server ##############################
[server]
# Protocol (http, https, socket, unit)
protocol = unit
In pkg/api/http_server.go:
import (
    // ...
    "net/http"
    "unit.nginx.org/go"
    "os"
    // ...
)

// ...

switch setting.Protocol {

// ...

case setting.HTTP, setting.HTTPS, setting.HTTP2:
    var err error
    listener, err = net.Listen("tcp", hs.httpSrv.Addr)
    if err != nil {
        return errutil.Wrapf(err, "failed to open listener on address %s", hs.httpSrv.Addr)
    }
case setting.SOCKET:
    var err error
    listener, err = net.ListenUnix("unix", &net.UnixAddr{Name: setting.SocketPath, Net: "unix"})
    if err != nil {
        return errutil.Wrapf(err, "failed to open listener for socket %s", setting.SocketPath)
    }
case setting.UNIT:
    var err error
    err = unit.ListenAndServe(hs.httpSrv.Addr, hs.macaron)
    if err == http.ErrServerClosed {
        hs.log.Debug("server was shutdown gracefully")
        return nil
    }
In pkg/setting/setting.go:
 const (
     HTTP              Scheme = "http"
     HTTPS             Scheme = "https"
     SOCKET            Scheme = "socket"
     UNIT              Scheme = "unit"
     DEFAULT_HTTP_ADDR string = "0.0.0.0"
 )

 // ...

 Protocol = HTTP
 protocolStr, err := valueAsString(server, "protocol", "http")
 // ...
 if protocolStr == "https" {
     Protocol = HTTPS
     CertFile = server.Key("cert_file").String()
     KeyFile = server.Key("cert_key").String()
 }
 if protocolStr == "h2" {
     Protocol = HTTP2
     CertFile = server.Key("cert_file").String()
     KeyFile = server.Key("cert_key").String()
 }
 if protocolStr == "socket" {
     Protocol = SOCKET
     SocketPath = server.Key("socket").String()
 }
 if protocolStr == "unit" {
     Protocol = UNIT
 }
Build Grafana:
$ cd $GOPATH/src/github.com/grafana/grafana
$ go get ./...
$ go run build.go setup
$ go run build.go build
$ yarn install --pure-lockfile
$ yarn start
Note the directory where the newly built grafana-server is placed, usually $GOPATH/bin/; it’s used for the executable option in the Unit configuration.
Run the following commands (as root) so Unit can access Grafana’s files:
# chown -R unit:unit $GOPATH/src/github.com/grafana/grafana
# chown unit:unit $GOPATH/bin/grafana-server
Note
The unit:unit user-group pair is available only with official packages, Docker images, and some third-party repos. Otherwise, account names may differ; run the ps aux | grep unitd command to be sure.
For further details, including permissions, see the security checklist.
Next, prepare the configuration (replace $GOPATH with its value in executable and working_directory):
{
    "listeners": {
        "*:3000": {
            "pass": "applications/grafana"
        }
    },

    "applications": {
        "grafana": {
            "executable": "$GOPATH/bin/grafana-server",
            "type": "external",
            "working_directory": "$GOPATH/src/github.com/grafana/grafana/"
        }
    }
}
See Go application options and the Grafana docs for details.
Upload the updated configuration. Assuming the JSON above was added to
config.json. Run the following command as root:# curl -X PUT --data-binary @config.json --unix-socket \ /path/to/control.unit.sock http://localhost/config/
Note
The control socket path may vary; run unitd -h or see Startup and Shutdown for details.
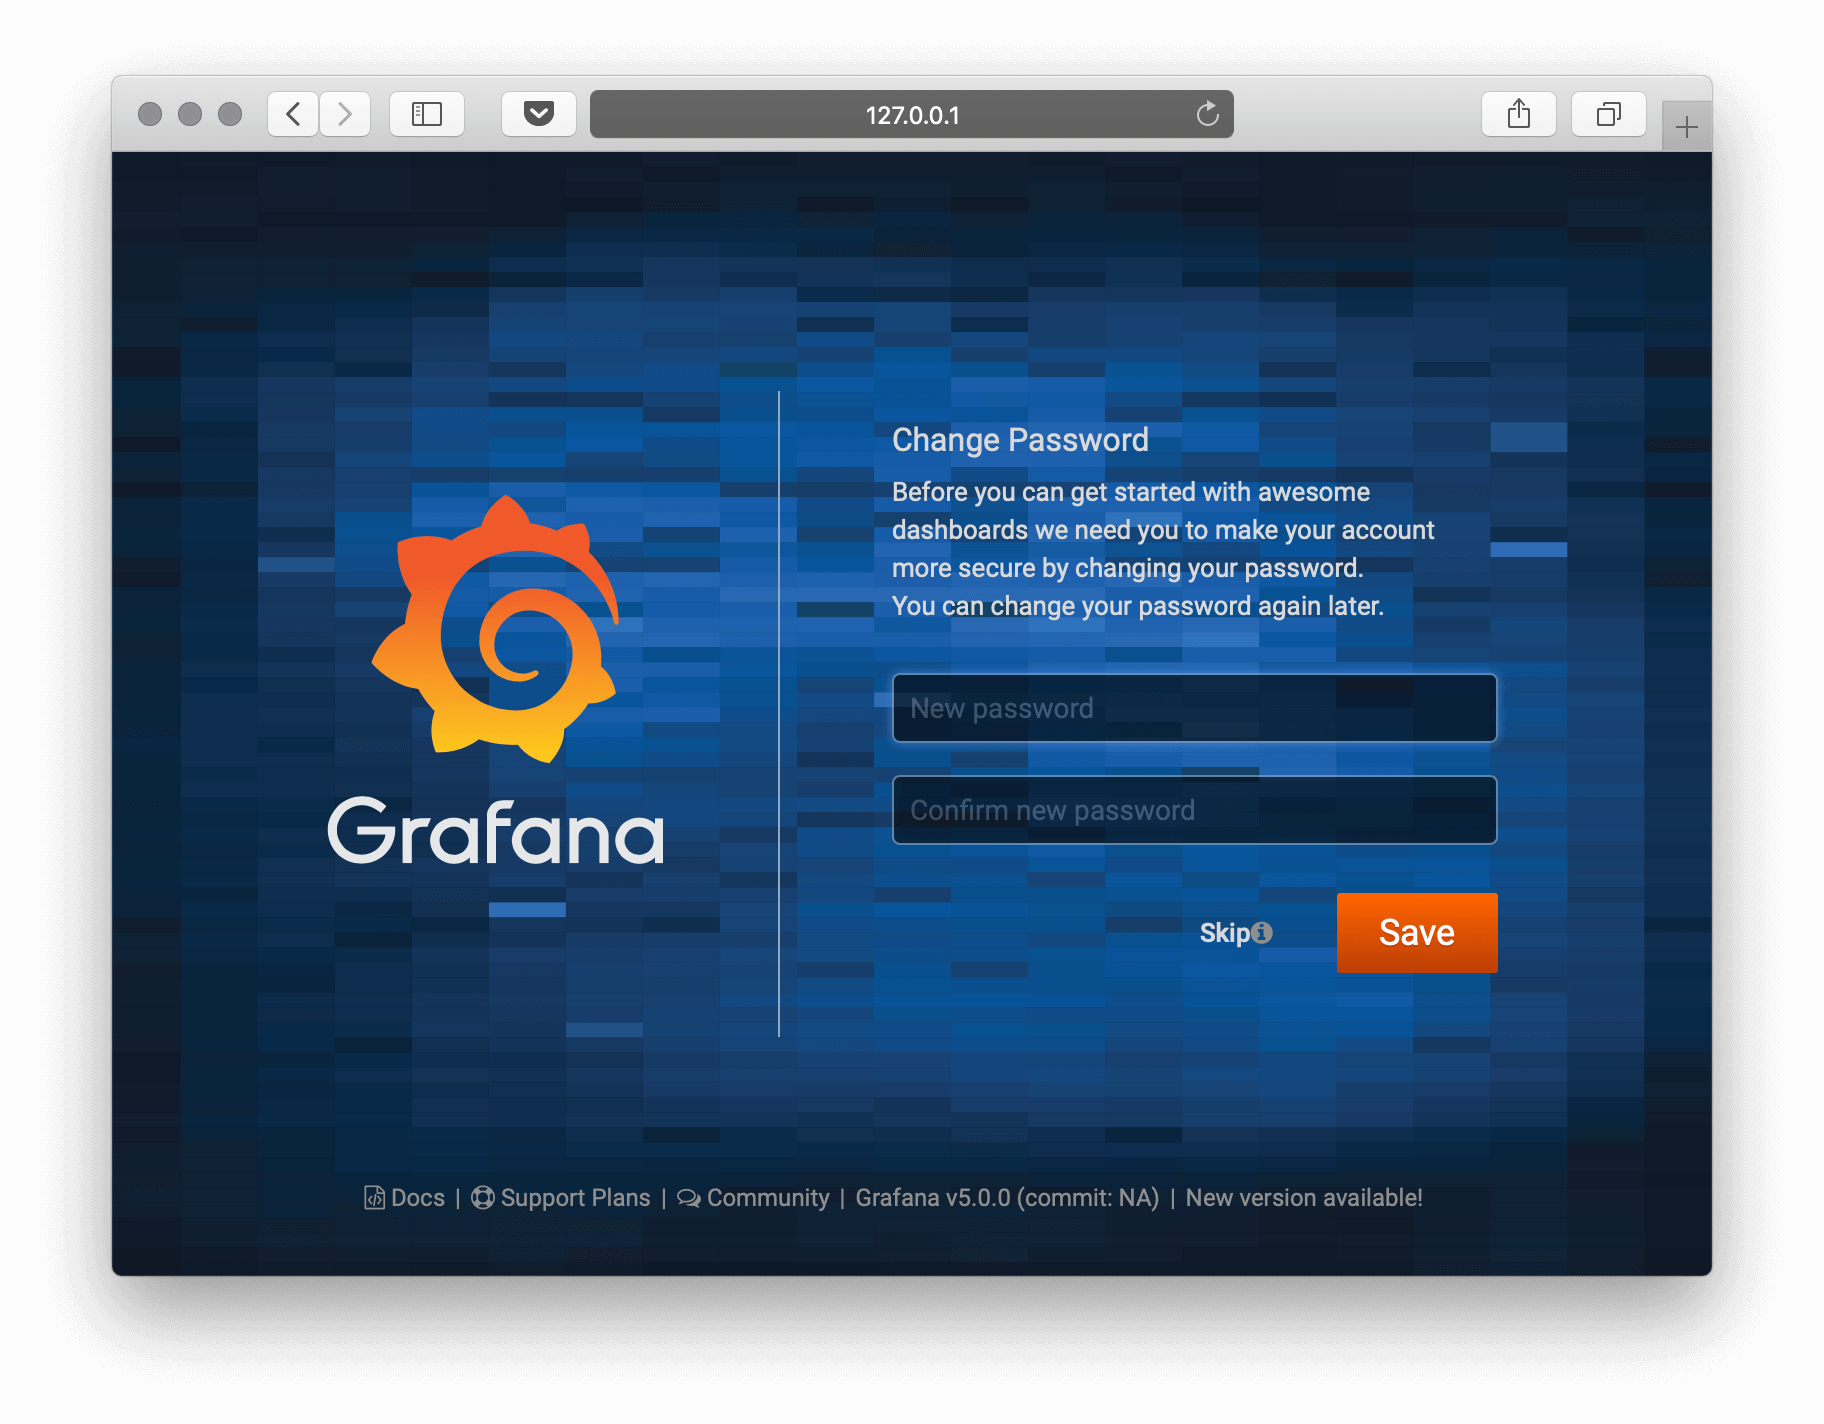
After a successful update, Grafana should be available on the listener’s IP and port:
